Care Subscriber Details
The Care Subscriber Details page offers a view of key subscriber-centric information, including name and address, transfer rate statistics and bandwidth usage. Also included are network insights associated with the specific hardware carrying service to the selected subscriber. These and more are explained in detail in the following sections.
Viewing Subscriber Details
After selecting the correct subscriber from the search results list, the Care Subscriber Details page appears.
From this page, another search can be executed if needed. Select the Subscriber Search field then enter the search criteria followed by the Enter key or select the  icon to execute the search.
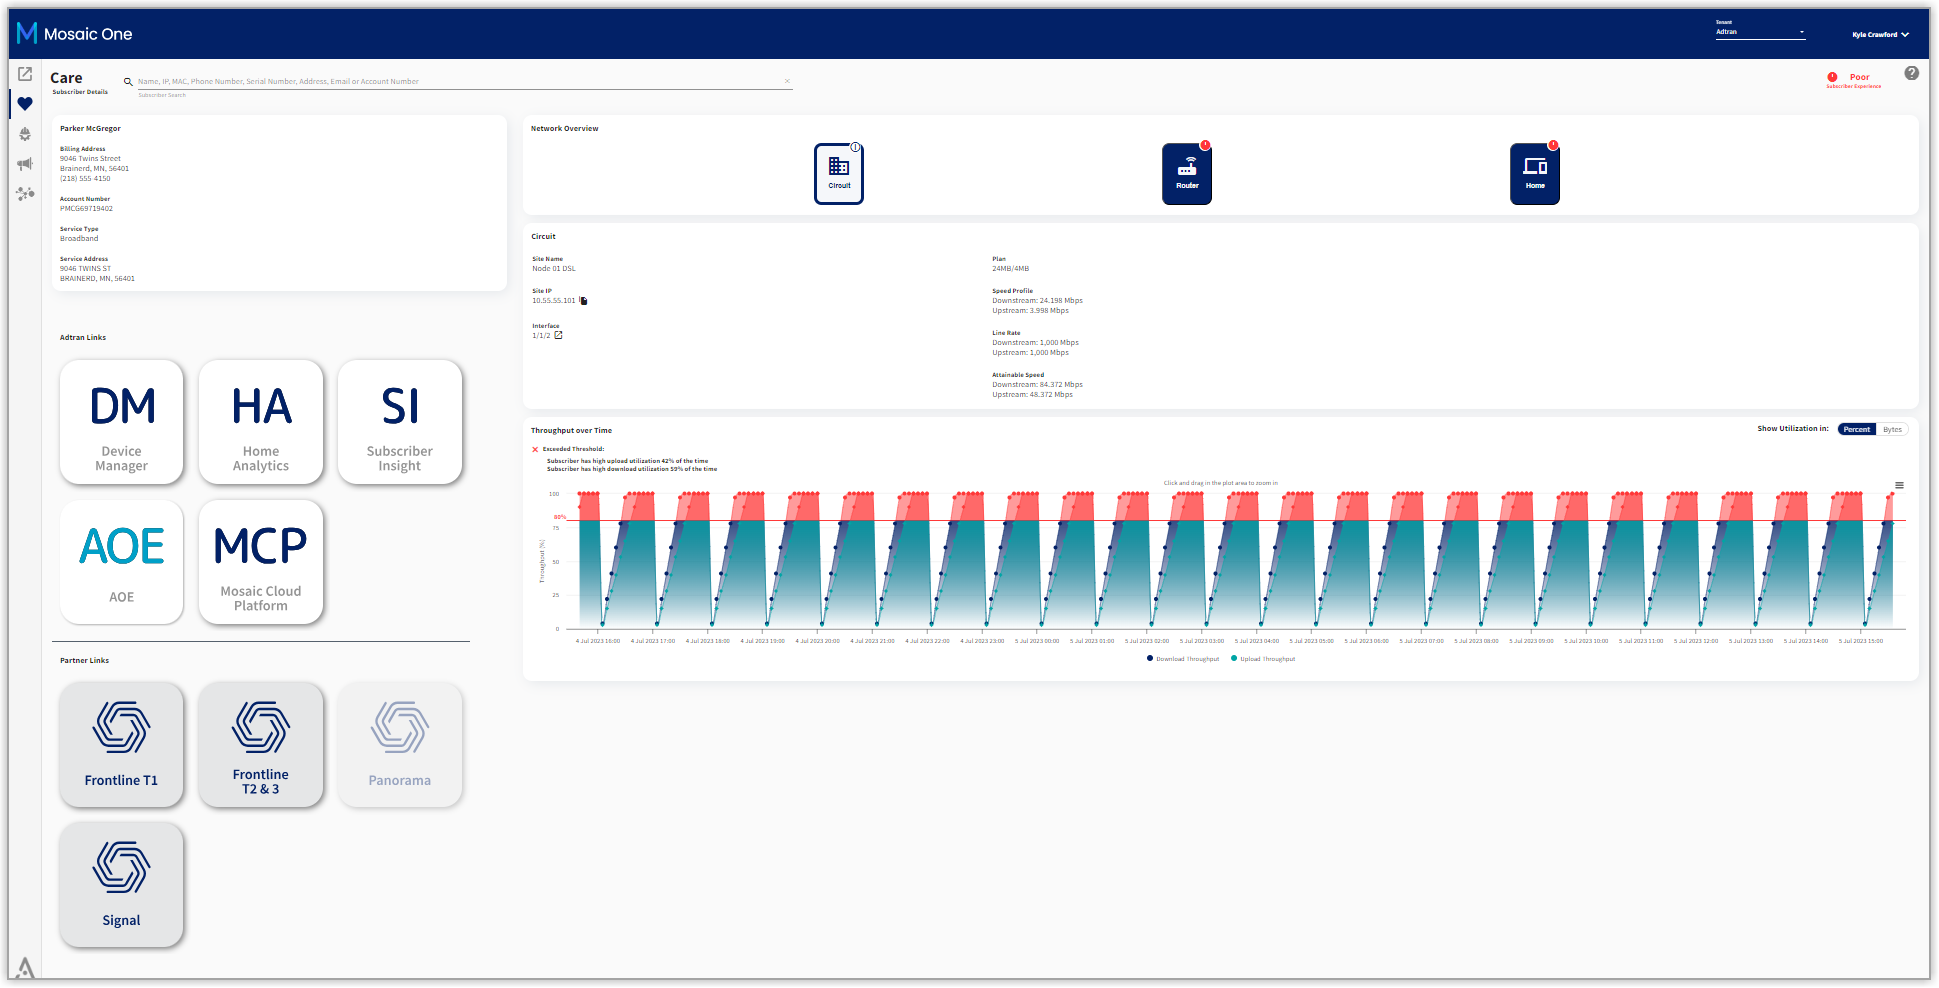
Near the upper right corner of the screen, an indication of the Subscriber Experience score is reflected. This is derived from the Experience Score which is defined in detail later in this article.
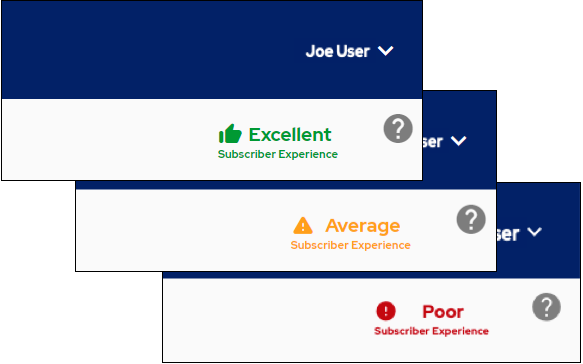
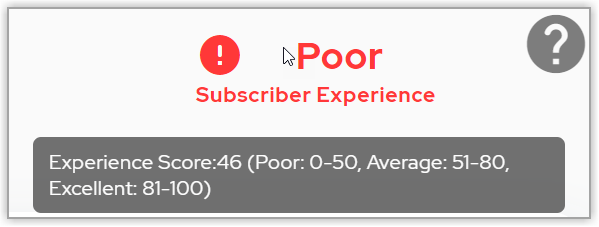
There are three possible states: Excellent, Average and Poor. Each of these states are color coded as green, orange and red (respectively). A tool tip is revealed when the mouse cursor hovers over this region of the screen describing the thresholds for these three conditions.
For example, Experience Score (Poor: 0-50, Average: 51-80, Excellent: 81-100)
Conditions that contribute to a low score will be indicated by a red ! next to the icons (Circuit, Router, and Home) in the Network Overview tile.
Available Subscriber Data
The Care Subscriber Details page consists of the following four tiles:
-
Contact information (such as name, address, ID, etc.) for the selected subscriber (upper left)
-
Network Overview displays an icon for each node (Circuit, Router, and Home) on the data path (upper middle)
-
Top Insights associated with the network hardware that directly services the selected subscriber (upper middle)
-
Throughput Over Time/Data Consumption time series charts (bottom)
The content of all four tiles is described in detail in the following sections.
Contact Information
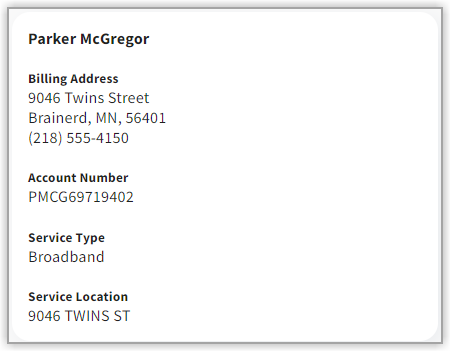
The first tile in the upper left displays the subscriber's contact information, including the subscriber name, street address, account number, and more.
Field Name Description
Name Subscriber first and last name.
Billing Address Billing address as set up by the customer.
Account Number Subscriber Account number as entered by the provider in the Mosaic Subscriber Insights application.
Service Type The name of the service package or subscription plan to which the end consumer is presently subscribed. This is an arbitrary string as entered by the provider in the Mosaic Subscriber Insights application. If this information has not been populated in Mosaic Subscriber Insights, the value for this field defaults to "No plan available."
When multiple lines of service are associated with the same subscriber, this field becomes a drop-down list with a row showing the Typefor each line of service. When multiple lines of service are present, this is indicated by a small triangle at the far right of this field.
INSTRUCTIONS: Select the field to open the drop-down list and choose a row in the list. The rest of the Care screen is refreshed to display all data and statistics for the selected row.
Service Location Physical address of the subscriber's location.
Network Overview
The second tile in the upper middle of the Care Subscriber Details page is a multipurpose display and is divided into icons for each node (Circuit, Device, and Home). Hovering over an icon with the mouse will provide in-depth information about the status (e.g., admin/oper status, light levels, last informed, or signal strength). Selecting an icon will re-purpose the display to show specialized information about the subscriber's CPE device.
Circuit
Select the Circuit icon (default) to display the following information:
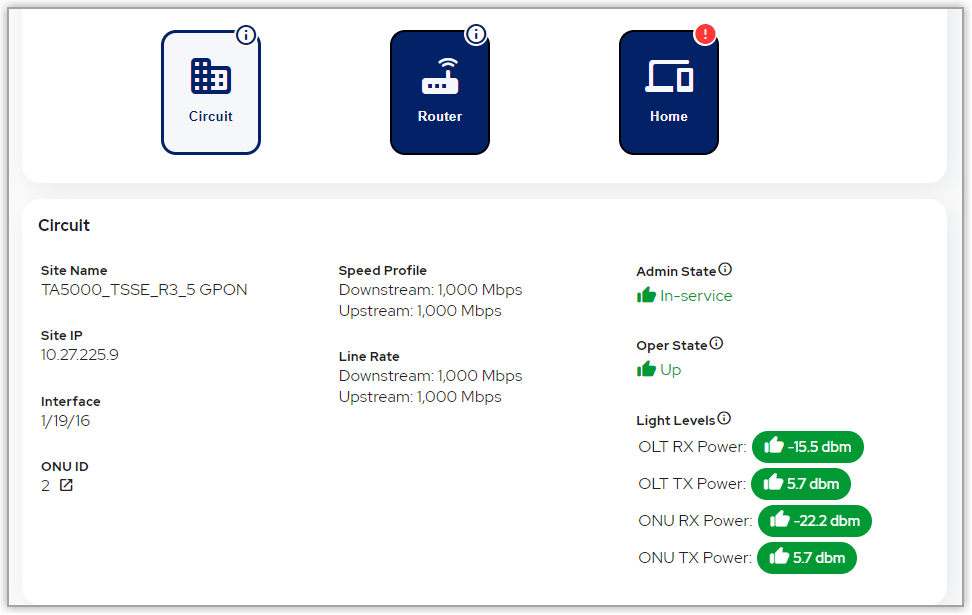
A red ! can appear on top of any of the icons (Circuit, Router, or Home) in the Network Overview tile. This is intended to draw attention to a low Experience Score (described above) and metrics that contribute to the cause(s) of the low score are available for study beneath the flagged tab(s).
Field Name Description
Site Name The name of the access chassis that services this subscriber's premises.
Site IP The IP address currently in use by this LAN device.
Interface The shelf/slot/port location of the associated card that provides service to the ONU for this subscriber's premises.
ONU ID The network equipment ID associated with the ONU that supports this subscriber's location.
Select the  icon to view ONU details.
Speed Profile Indicates the transfer rate provisioned to the CPE, associated with the subscribed plan. This parameter is read directly from the CPE device.
Line Rate The present transfer rate of the line. Downstream and upstream rates are displayed separately. Expressed in Megabits Per Second (Mbps). This field will be empty when no data is available.
Admin State Displays the administrative status of the network hardware that supports this subscriber's location. The administrative state displayed will be one of the following:
- In-service
- Out of service
- Out of service- Maintenence
- Out of service - Unassigned
- Unknown
Oper State Displays the operational status of the network hardware that supports this subscriber's location. The operational state displayed will be one of the following:
- Up
- Down
- Discovering
- Test
- Unknown
Light Levels Shows fiber optic light levels for the subscriber's circuit. Statistics include:
- OLT RX Power: Receive power as measured from the OLT's perspective. Expressed in dbm.
- OLT TX Power: Transmit power as measured from the OLT's perspective. Expressed in dbm.
- ONU RX Power: Receive power as measured from the ONU's perspective. Expressed in dbm.
- ONU TX Power: Transmit power as measured from the ONU's perspective. Expressed in dbm.
Router
Select the Router icon to display the following information regarding the CPE device:
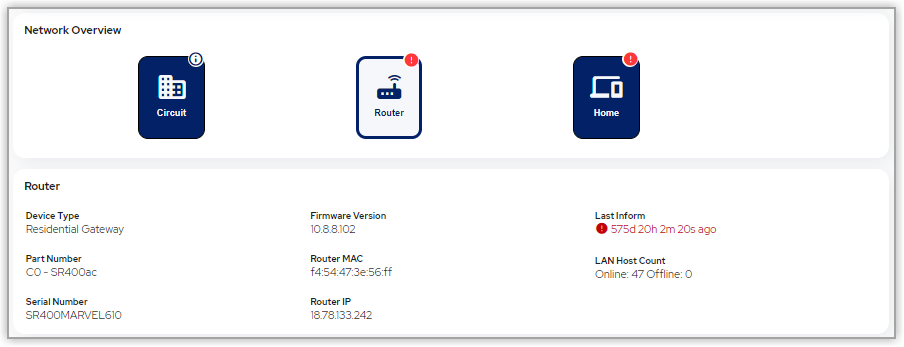
A red ! can appear on top of any of the icons (Circuit, Router, or Home) in the Network Overview tile. This is intended to draw attention to a low Experience Score (described above) and metrics that contribute to the cause(s) of the low score are available for study beneath the flagged tab(s).
Field Name Description
Device Type Displays the type of CPE device at this subscriber's location. Example values for this field include DSL Modem, ONU, Residential Gateway, Integrated DSL Modem, Integrated ONU, Cable Modem, Integrated Cable Modem.
Part Number Displays model number information for the CPE device at this subscriber's location.
Serial Number A number assigned by the manufacturer of the subscriber's gateway to uniquely identify each device that is produced.
Firmware Version The revision number associated with the software currently loaded on the subscriber's gateway.
Router MAC The Internet-facing Media Access Control (MAC) address of the subscriber's gateway.
Router IP The address assigned to the Internet-facing (public-facing) side of a network by the ISP.
Last Inform The most recent time stamp indicating when the subscriber's gateway last checked in with its Auto Configuration Server (e.g. Mosaic Device Manager) to synchronize its data model. Expressed as number of days (d), hour (h), minutes (m) and seconds (s) elapsed from the current time. e.g. 4d 12h 19m 22s ago
LAN Host Count The number of LAN client devices currently Online and connected to the subscriber's gateway.
Home
Select the Home icon to display a list of all the connected LAN devices. The following details are displayed for each LAN device.
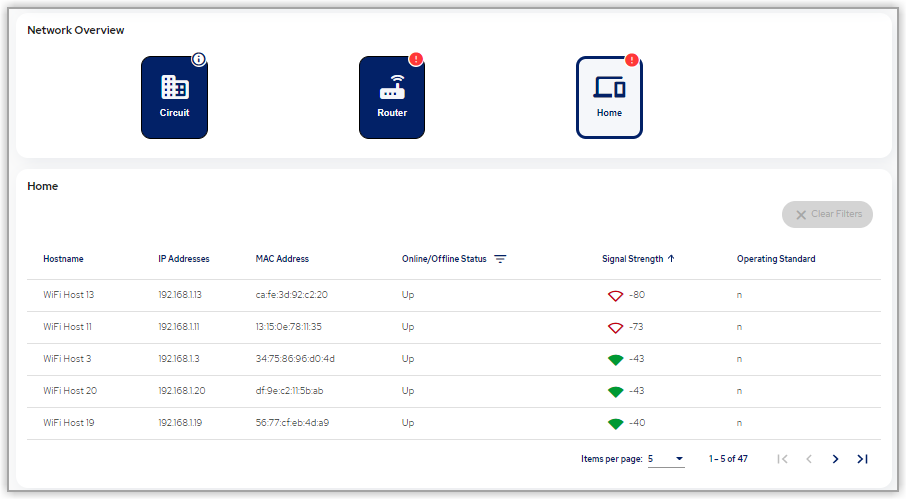
A red ! can appear on top of any of the icons (Circuit, Router, or Home) in the Network Overview tile. This is intended to draw attention to a low Experience Score (described above) and metrics that contribute to the cause(s) of the low score are available for study beneath the flagged tab(s)
Field Name Description
Hostname The name by which this LAN device is known across the network.
IP Address The IP address currently in use by this LAN device.
MAC Address The MAC address of the Local Area Network (LAN) device. This is a unique identifier assigned to the device's hardware used to differentiate this device from other LAN devices on the network.
Online/Offline Status Indicates whether or not the LAN device is actively communicating with the subscriber's gateway.
- Potential values include Up and Down.
Signal Strength Displays the WiFi Received Signal Strength Indicator (RSSI) value. This value is measured in dBm. The closer the value is to zero, the stronger the signal. The signal strength is color coded to reflect thresholds for poor and average states.
-
Less than -72 dBm is indicates poor signal strength and is shown in red. This reading will also trigger a red ! to be displayed on the Home icon in the Network Overview tile as described earlier in this article.
-
Between -72 and -65 is indicates average signal strength and is shown in orange.
-
Greater than -65 indicates excellent signal strength and is shown in green.
This attribute only appears for LAN devices connected via WiFi.
Operating Standard Indicates which of the 802.11 standards is currently used by the WiFi connection between this LAN host and the subscriber's gateway. This line item only appears only for LAN devices connected via WiFi. Potential values include a, b, g, n, ac, and ax.
Top Insights Table
This tile in the upper middle of the Care Subscriber Details page (next to the Contact Information tile) displays insights when they are available. If no insight is found for a subscriber during insights scan or when the scan itself did not happen, the Top Insights table will be replaced by the below notifications.
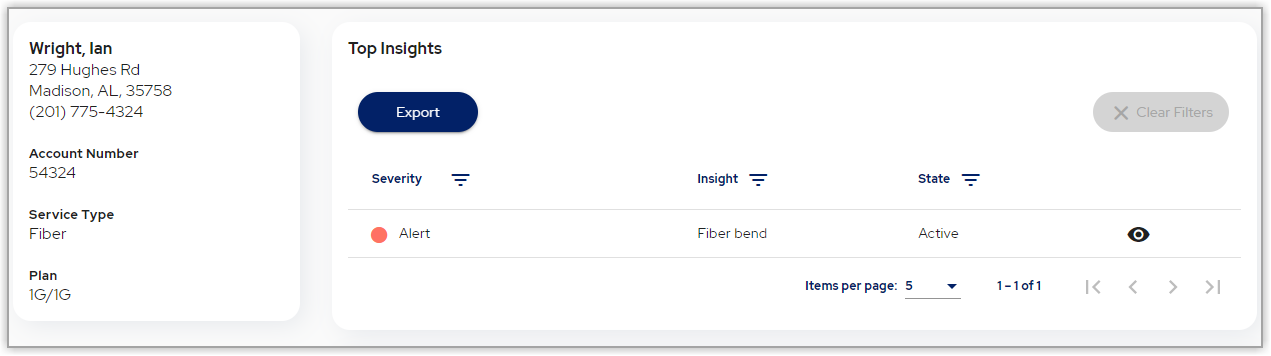
If no insight is found for a subscriber during insights scan or when the scan itself did not happen, the Top Insights tile will be replaced by the below notifications.


Throughput Over Time/Data Consumption
By default, the Throughput over Time chart will show at the bottom of the Care Subscriber Details screen. This chart displays a time series chart the previous 24 hours of the subscriber's percent throughput usage.
Downstream throughput is represented in blue, and upload throughput is represented in green.
The red horizontal line is set at 80 % utilization. If either the upload or download curves exceed this threshold, the subscriber is likely to be experiencing a poor internet experience because consumption exceeds what are provisioned for.
You can specialize the display to show only upload or only download throughput usage by selecting the text label or colored dot in the legend below the chart.
-
Select Upload Throughput (or the green colored dot) to toggle the display of upload data on and off.
-
Select Download Throughput (or the blue colored dot) to toggle the display of download data on and off.
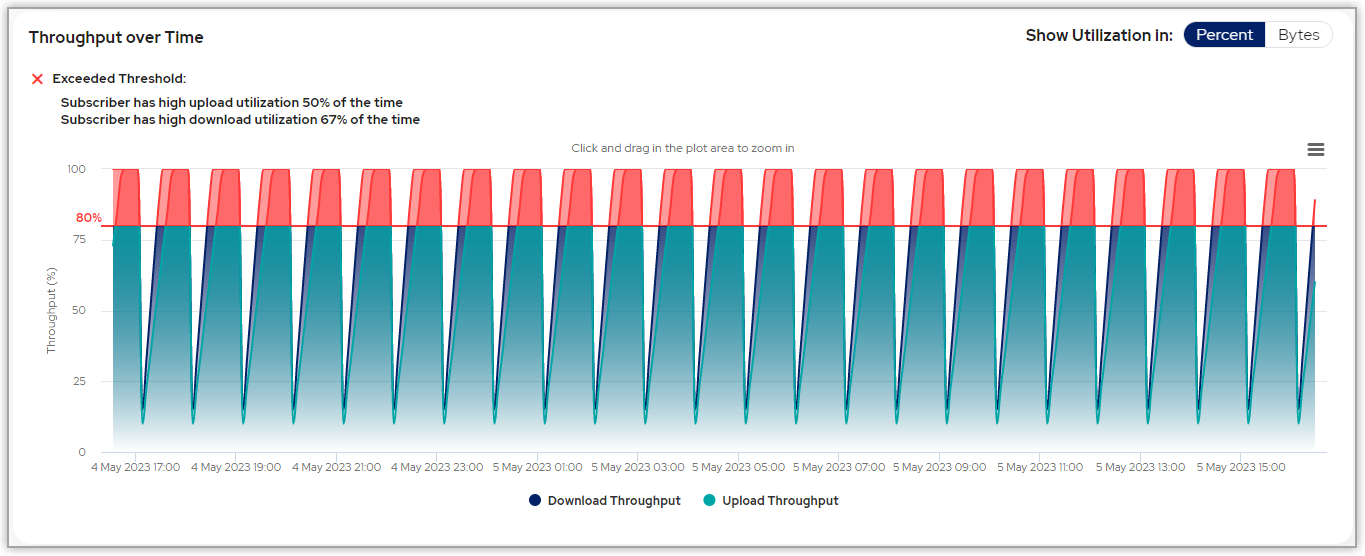
Reference the vertical scale at the left of the chart to interpret the amount of bandwidth being used along the time line. The horizontal labeling across the bottom of the chart identifies the date associated with the throughput usage data point. For a greater precision reading, hover your cursor over a particular data point along the chart and observe the information displayed in the date and time-stamped tool tip that appears.
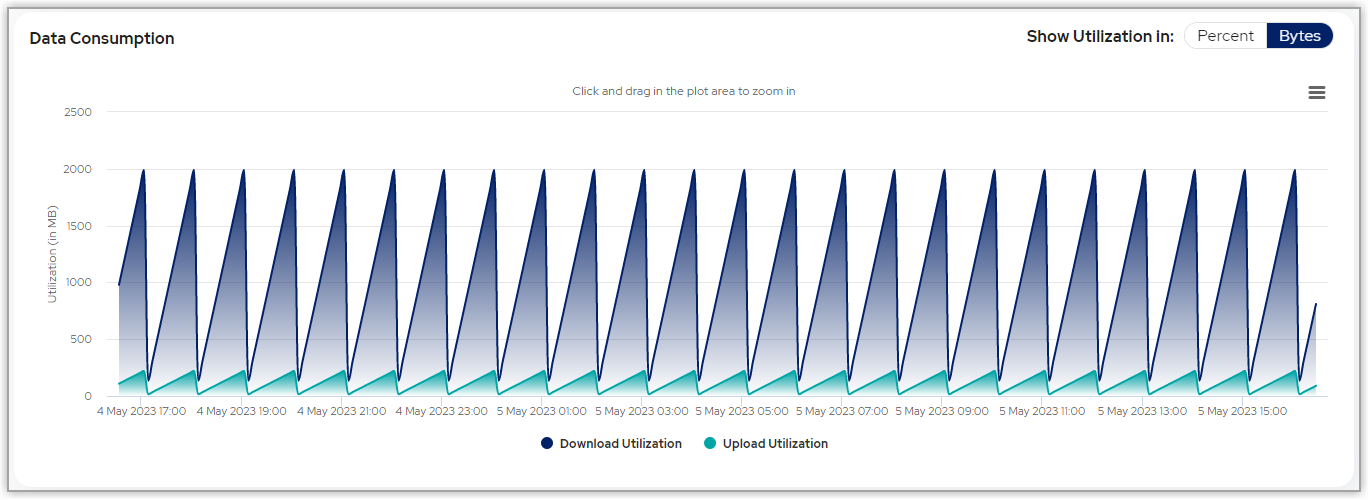
The Data Consumption chart can be toggled on by selecting the Show Utilization in Bytes button. This chart displays a time series chart the previous 24 hours of the subscriber's data consumption information in bytes.
You can specialize the display to show only upload or only download throughput usage by selecting the text label or colored dot in the legend below the chart.
-
Select Upload Utilization (or the green colored dot) to toggle the display of upload utilization on and off.
-
Select Download Utilization (or the blue colored dot) to toggle the display of download utilization on and off.
Open Applications
A series of oval buttons appear in the lower left that provide quick access to the various supporting applications from which Mosaic One gathers data.
Available application buttons shown may include:
-
Mosaic Device Manager
-
Mosaic Home Analytics
-
Mosaic Subscriber Insight
-
AOE
-
Plume Frontline
-
Plume Panorama
-
Plume Signal
Applications available in your instance may vary from the list above and are dependent upon your sales agreement, the specific applications to which your organization has subscribed and that the user has been granted access to.
Select the button for the application to be opened. The selected application opens in a new tab to the general landing page for that application.
In short, the functionality is identical to the buttons found on the Applications page and is described here.
Related Articles: